TRENDS AND CURRENT STATISTICS
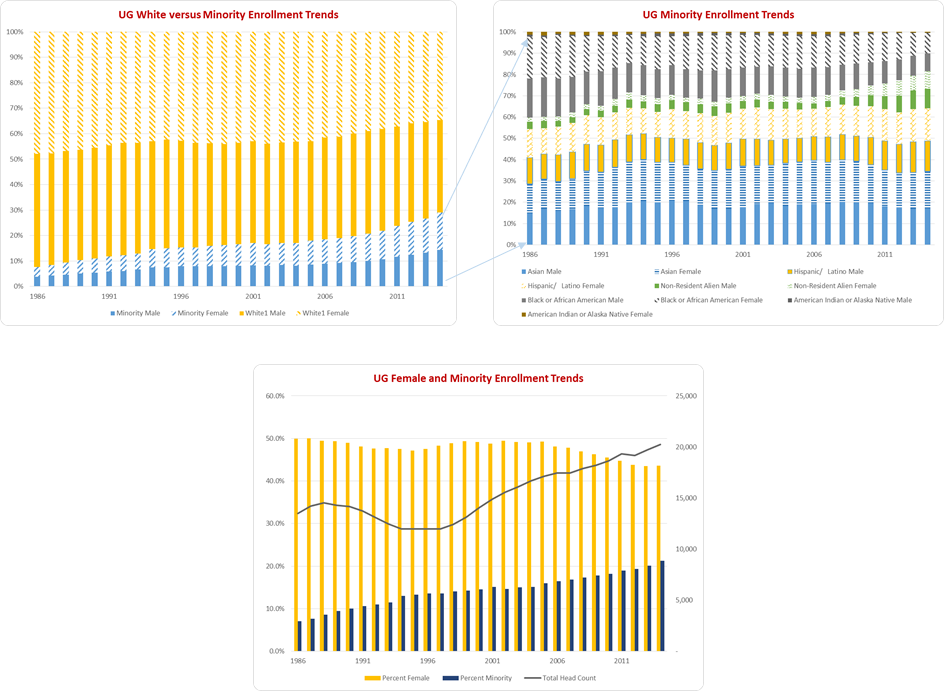
UNDERGRADUATE STUDENTS (ENROLLMENT)
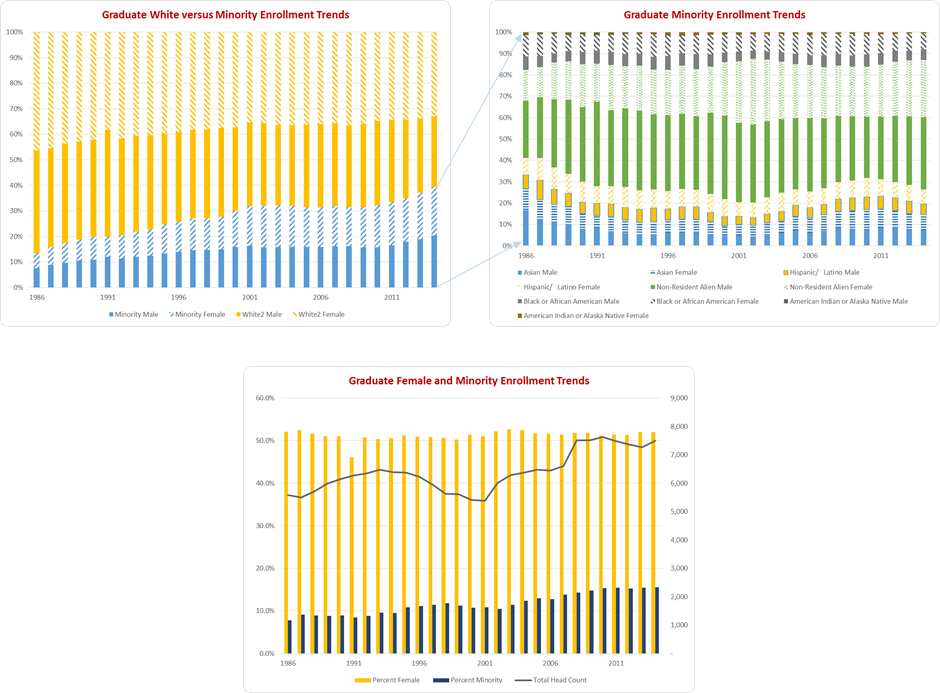
GRADUATE STUDENTS (ENROLLMENT)
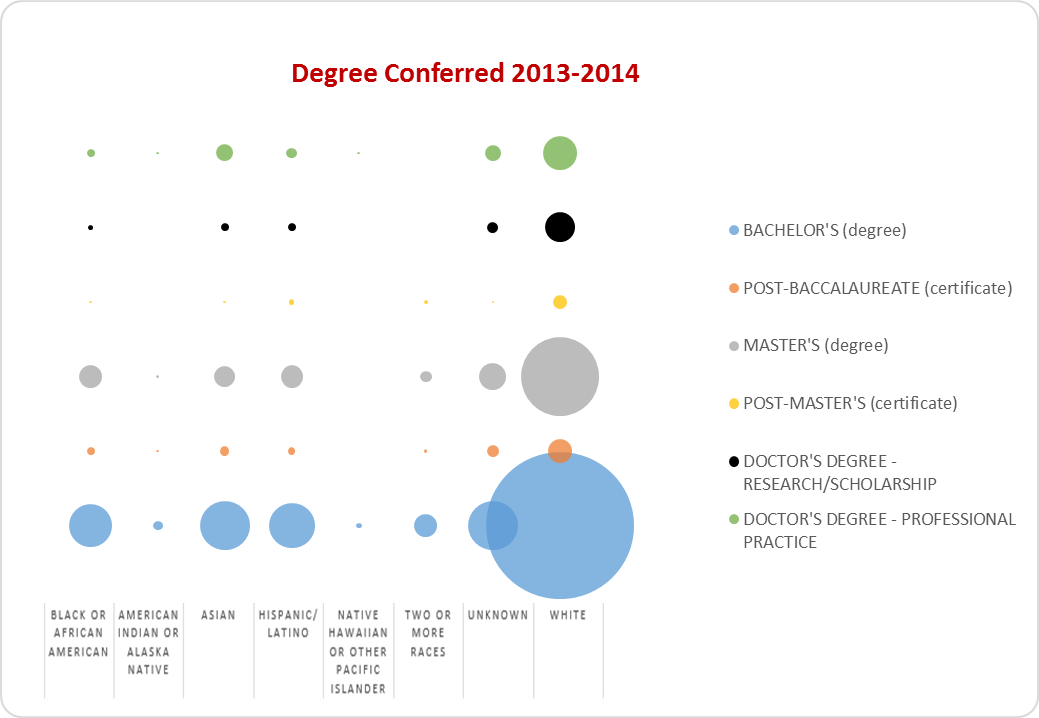
STUDENTS (GRADUATIONS 2013-2014)
FACULTY

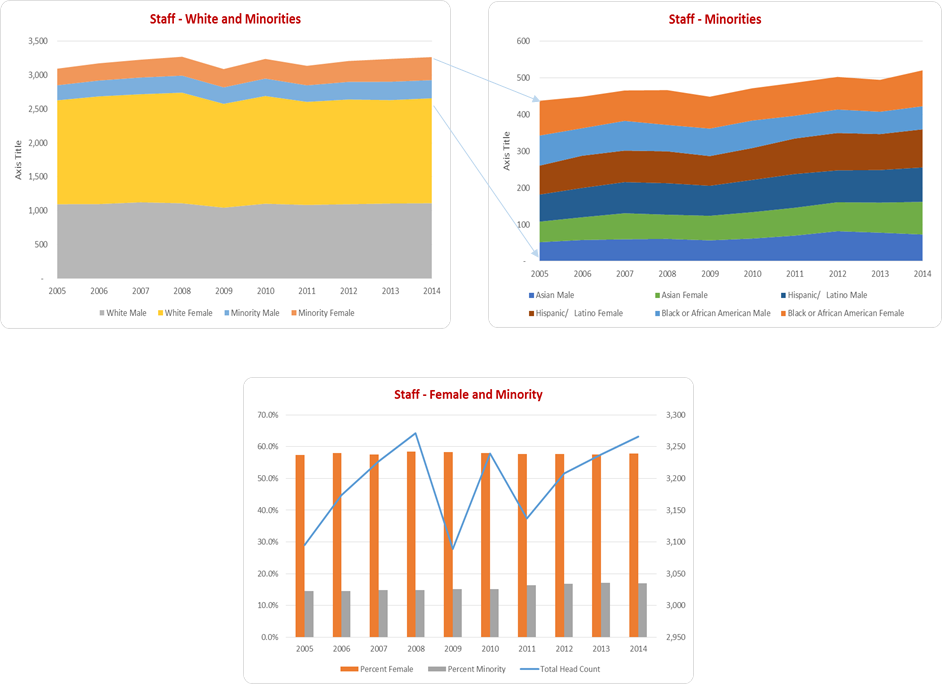
STAFF
| University of Connecticut Compared to U.S. News Top 30 Public National Universities, 2015 Edition Fall 2014 Full-time Tenured and Tenure Track Instructional Faculty |
||||||
| Rank | School | Total Minority | Rank | School | Total Underrep. Minority | |
| 1 | Georgia Institute of Technology | 29.8% | 1 | University of North Carolina at Chapel Hill | 11.9% | |
| 2 | University of California-Irvine | 28.1% | 2 | The University of Texas at Austin | 11.7% | |
| 3 | University of California-Los Angeles | 26.7% | 3 | University of Illinois at Urbana-Champaign | 11.5% | |
| 4 | University of Illinois at Urbana-Champaign | 26.4% | 4 | University of California-Los Angeles | 11.0% | |
| 5 | Purdue University | 25.5% | 5 | University of Georgia | 10.8% | |
| 5 | Texas A & M University-College Station | 25.5% | 6 | University of California-Santa Barbara | 10.6% | |
| 7 | University of Michigan-Ann Arbor | 24.6% | 7 | Texas A & M University-College Station | 10.1% | |
| 8 | University of Maryland-College Park | 23.5% | 7 | Michigan State University | 10.1% | |
| 9 | Michigan State University | 23.4% | 9 | University of Florida | 9.8% | |
| 9 | University of Florida | 23.4% | 9 | University of California-Berkeley | 9.8% | |
| 11 | University of California-San Diego | 23.2% | 11 | University of Michigan-Ann Arbor | 9.7% | |
| 12 | University of California-Davis | 23.1% | 12 | University of California-Irvine | 9.3% | |
| 13 | University of Pittsburgh | 22.5% | 13 | University of Maryland-College Park | 9.2% | |
| 14 | University of California-Berkeley | 22.2% | 14 | Pennsylvania State University | 8.9% | |
| 15 | The University of Texas at Austin | 21.5% | 15 | University of California-San Diego | 8.5% | |
| 16 | Pennsylvania State University | 21.2% | 16 | UConn excl UCHC | 8.1% | |
| 16 | UConn excl UCHC | 21.2% | 17 | University of California-Davis | 8.0% | |
| 18 | University of Georgia | 21.1% | 18 | Virginia Tech | 7.6% | |
| 19 | University of California-Santa Barbara | 20.9% | 19 | Ohio State University | 7.5% | |
| 20 | University of North Carolina at Chapel Hill | 20.6% | 20 | Purdue University | 7.2% | |
| 21 | Virginia Tech | 19.5% | 20 | College of William and Mary | 7.2% | |
| 22 | Clemson University | 19.4% | 22 | University of Wisconsin-Madison | 7.1% | |
| 23 | Rutgers University-New Brunswick | 19.3% | 23 | University of Virginia | 7.0% | |
| 24 | University of Minnesota-Twin Cities | 19.2% | 23 | University of Iowa | 7.0% | |
| 25 | Ohio State University | 18.7% | 25 | Rutgers University-New Brunswick | 6.9% | |
| 25 | University of Wisconsin-Madison | 18.7% | 26 | University of Minnesota-Twin Cities | 6.6% | |
| 27 | University of Iowa | 18.5% | 27 | University of Washington | 6.5% | |
| 28 | University of Virginia | 15.5% | 28 | Georgia Institute of Technology | 6.2% | |
| 29 | College of William and Mary | 12.4% | 29 | University of Pittsburgh | 6.0% | |
| 30 | University of Washington | 11.7% | 30 | Clemson University | 5.7% | |
| OIRE/July 28, 2015 | ||||||
| Note: Minority includes Asian, Black or African American, American Indian or Alaska Native, Hispanic or Latino, Native Hawaiian or Other Pacific Islander, and Two or More Races. For IPEDS reporting, Non-Resident Aliens are reported separately and are not included in this race/ethnicity data. | ||||||
| Note: Underrepresented Minority includes Black or African American, American Indian or Alaska Native, Hispanic or Latino, Native Hawaiian or Other Pacific Islander, and Two or More Races. For IPEDS reporting, Non-Resident Aliens are reported separately and are not included in this race/ethnicity data. | ||||||
| Source: IPEDS Data Center, Fall 2014 Human Resources Survey. | ||||||